Analytics are a crucial tool to understanding how and whether your social media marketing is effective. You may already be aware of Google analytics and the wealth of data you can glean from it. But did you know there are other analytics tools available?
For instance, do you publish posts on Facebook, cross your fingers and hope they’re reaching your target audience? Do you measure success solely in terms of fan counts? If so, you need a tool that can help you see exactly whom you’re reaching, and what impact—if any—your posts are having on them.
We want to show you how to do that with a tool you may not have known about: Facebook analytics. With over two billion active users, Facebook is the top social media site in terms of reach, and is thus one of the most powerful marketing platforms available.
The Facebook analytics tool is different from—and in some ways better than—Google analytics, because of the stats available. It allows you to see real-time statistics about visitors to your Facebook page, including who’s viewing them, from which sources, and—most important—how they’re engaging with your posts.
Facebook analytics provides valuable data that you can use as a performance indicator. Here’s just a sample of what you can learn from this powerful tool.
Where to find it
If you’re using Facebook for business, simply go to that page and click on Insights. (Tip: you must have at least 30 followers to access Insights.) If you’re working from a mobile device, you will first have to download the free Facebook Analytics app.
What you’ll see there
The first thing you’ll see is a dashboard that immediately shows you highlights like Page Likes, Page Reach, and Engagement.
“Page Likes” is self-explanatory. You’ll see the total number of page likes, the net total of likes (that is, the new likes minus the unlikes), and where each “like” originated (from a mobile device, from a page visit, or from a page suggestion). You can also see the specific time periods that likes surged or declined.
“Post Reach” is the number of people who have seen the post or content you’re researching, as well as how they interacted with it: likes, comments, shares, hide, report as spam, and unlikes.
“Page Engagement” tells you what actions the people who have seen the page have taken, such as liking, commenting, or sharing the page or post.
How to use it
The “Page Likes” information can tell you how many followers you’ve gained, as well as their source, giving you insight into the success of your posts or ad campaign. For example, if you notice a spike in fans each time you post video content, then, of course, post more videos!
“Post Reach” breaks the raw data down to give you actionable information about which posts were the most popular, which resulted in negative responses, and which negatively impacted your marketing goals.
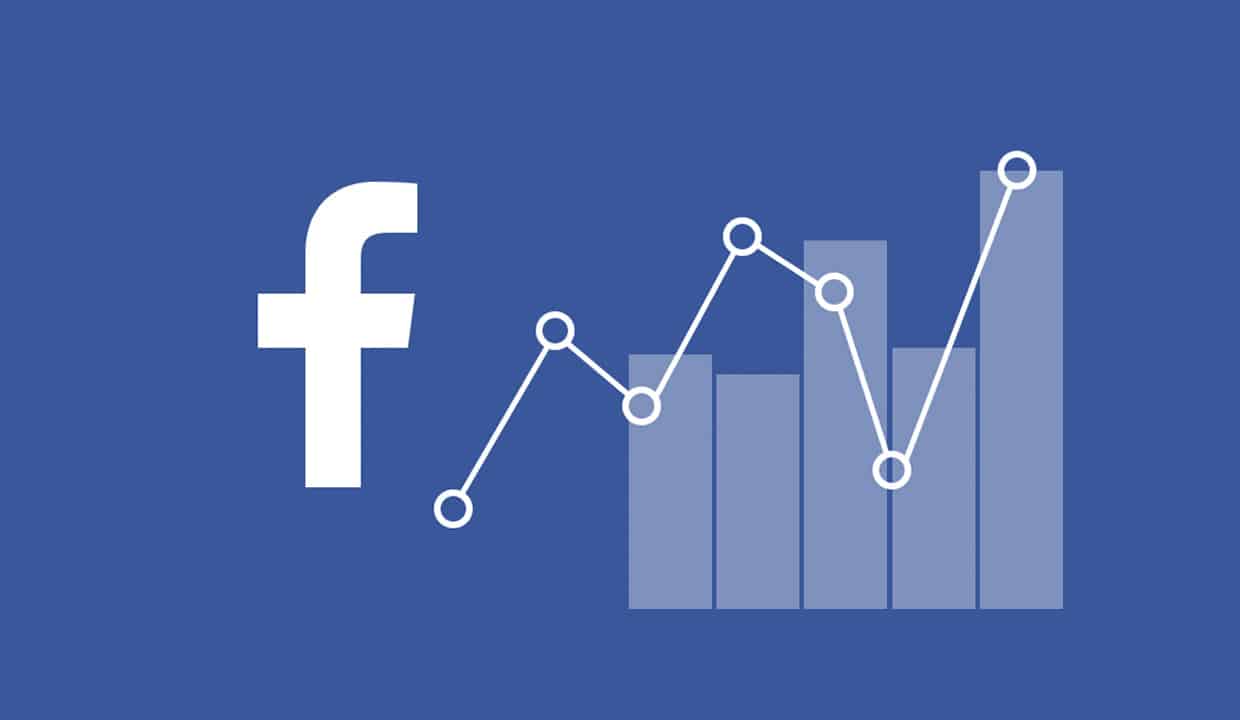
“Page Engagement” helps you monitor and analyze the shares, likes, comments, and other types of fan engagement on Facebook, providing graphs that allow you to compare results of your content performance over a period of time.
You can also find out which of your fans are most active, their demographic metrics, and audience growth over the same periods.
This is just the beginning of the information you can glean from Facebook Analytics, and there are many other ways to gather and use the available data. This includes creating funnels to learn more about your conversion rates, as well as tracking overall visits and gauging the success of videos, all of which can better help you target your marketing efforts.
Our social media marketing managers are experts in the use of analytical tools to help you gauge the effectiveness of your marketing campaign. Just let us know what we can do for you!




Leave A Comment